13 January 2013
Using salt to feed the graphite carbon daemon
Part #2 in the VM visualisations series using salt. Read Part #1
I deemed my experiment in Part #1 a success, but it had a huge drawback in not keeping any state, it was only refreshing fresh data all the time. It also would not scale for multi user, because the fetching would be too heavy for many users to be monitoring simultaneously. Thus I had a new goal, separate the metric retrieving from the metric displaying. The plan is to collect metrics using Salt and its Returner component. Returners makes the salt published commands return data using a different route than back to the publisher (master). But first I had to choose a backend.
Cubism the web frontend I am using comes with support for two metric storing backends:
Cube has a mongodb + node stack. Graphite is built using python components whisper, carbon, and graphite-web. Whisper is a RRD-alike format, Carbon is a network daemon and collector backend for whisper, and graphite-web is written in django. Since I'm a fan of both python and django I decided to go with the graphite stack.
A simple diagram of the flow of this setup:
 The salt server                 targetted minions                The graphite sever
+----------------+             +------------------+      salt    +------------------+
|                |             |                  |    returner  |                  |
|  salt master   +---zeromq---->   salt minion    +-   TCP:2033 ->   carbon daemon  |
|                |             |                  |              |                  |
+----------------+             +------------------+              +------------------+
Graphite server
I wrote a simple graphite state to install the graphite server. Two parts is not covered in the state, the configuration files and service starting. I used all defaults everywhere.
/srv/salt/base/graphite/init.sls
graphite:
  pkg.installed:
    - pkgs:
      - python-django
      - python-pip
      - python-django-tagging
      - python-dev
      - python-twisted
      - python-memcache
      - memcached
      - python-cairo

graphite-web:
  pip.installed:
      - require:
        - pkg: graphite

whisper:
  pip.installed:
      - require:
        - pkg: graphite

carbon:
  pip.installed:
      - require:
        - pkg: graphite
The carbon returner
Carbon supports two protocols and pickle, I struggled abit with getting pickle to work, so for testing I am using the text line protocol. That also enabled me to debug easier. I'm also happy to say that my carbon returner got merged into saltstack upstream, so it can be used and improved by everyone that's interested.
salt/returners/carbon_returner.py
'''
Take data from salt and "return" it into a carbon receiver

Add the following configuration to your minion configuration files::

    carbon.host: <server ip address>
    carbon.port: 2003

'''

import syslog
import pickle
import socket
import logging
import time
import struct

log = logging.getLogger(__name__)

def __virtual__():
    return 'carbon'

def _formatHostname(hostname, separator='_'):
    ''' carbon uses . as separator, so replace this in the hostname '''
    return hostname.replace('.', separator)

def returner(ret):
    '''
    Return data to a remote carbon server using the pickle format
    '''
    host = __salt__['config.option']('carbon.host')
    port = __salt__['config.option']('carbon.port')
    log.debug('Carbon minion configured with host: {0}:{1}'.format(host, port))
    if not host or not port:
        log.error('Host or port not defined')
        return

    try:
        carbon_sock = socket.socket(socket.AF_INET, socket.SOCK_STREAM, socket.IPPROTO_TCP)
        carbon_sock.connect((host, port))
    except socket.error as e:
        log.error('Error connecting to {0}:{1}, {2}'.format(host, port, e))
        return

    timestamp = int(time.time())

    saltdata = ret['return']
    metric_base = ret['fun']
    metrics = []
    for name, vals in saltdata.items():
        for key, val in vals.items():
            # XXX: force datatype, needs typechecks, etc
            val = int(val)
            metrics.append((metric_base + '.' + _formatHostname(name) + '.' + key, val, timestamp))

    def send_textmetrics(metrics):
        ''' Use text protorocol to send metric over socket '''
        data = []
        for metric in metrics:
            metric = '{0} {1} {2}'.format(metric[0], metric[1], metric[2])
            data.append(metric)
        data = '\n'.join(data)
        total_sent_bytes = 0
        while total_sent_bytes < len(data):
            sent_bytes = carbon_sock.send(data[total_sent_bytes:])
            if sent_bytes == 0:
                log.error('Bytes sent 0, Connection reset?')
                return
            logging.debug("Sent %d bytes to carbon" % sent_bytes)
            total_sent_bytes += sent_bytes

    # Send metrics
    send_textmetrics(metrics)

    # Shut down and close socket
    carbon_sock.shutdown(socket.SHUT_RDWR)
    carbon_sock.close()
Metric pushing
The carbon returner has a weak point in its design, it only supports one type of data, dicts within dicts, since that was all I had to support to get my virt module metrics into carbon. One thing it could be easily extended to do is parse output from all the existing munin plugins, or collected plugins. But lets not get ahead of ourselves, lets see if the runner works.
I decided on a simple 10 second timer for pushing data, that seemed granular enough for my purposes. Turns out salt got support for running scheduled command this weekend, and it will be featured in the upcoming 0.12-release. Eager to get my data scheduled I fetched latest git and wrote a quick runner to be scheduled on the master:
/etc/salt/master
schedule:
  vmmon:
     function: carbonmon.pollpush
     seconds: 10
The runner
This runner just publishes the commands to be run in an async fashion. No data is returned to the master. I use a simple list to specify my virt hosts.
salt/runners/carbonmon.py
import salt.client
import sys

def pollpush():
    '''
    Run the monitoring command and return to carbon
    '''
    client = salt.client.LocalClient(__opts__['conf_file'])
    cmds = ('virt.vm_diskstats', 'virt.vm_netstats', 'virt.vm_cputime')
    nodes = 'chani,harkonnen,fremen'
    for cmd in cmds:
        jid = client.cmd_async(nodes, cmd, expr_form='list', ret='carbon', timeout=__opts__['timeout'])
et voilà! metrics are now persisted by the graphite stack. And I can now return to my client and rewrite cubism client to use graphite backend.
The JavaScript
The graphite queries include wildcard support, so I could easily get graphs for rxbytes, txbytes, disk_counters and cputime using one simple function. If I want multicolored graphs per host I would have to make some changes.
var graphite_cubism = function(metric_name, metric_vals) {
    var seconds = 10;

    // Create cubism context
    context = cubism.context()
        .serverDelay(seconds * 1000) // allow 10 seconds of collection lag
        .step(seconds * 1000)         // 10 seconds per value
        .size(700);          // fetch 1080 values (pixels)
    graphite = context.graphite('/graphite/');
    // Search graphite for CPU metrics
    graphite.find('virt.'+metric_name+'.*.'+metric_vals, function(error, results) {

        var metrics = []; // list of metrics

        $.each(results, function(idx, metric) {
            var alias = metric.split('.')[2] + ' ' + metric.split('.').slice(-1);
            metrics.push(graphite.metric("sumSeries(nonNegativeDerivative("+metric+"))").
        });

        // Create the graphs and add to #graphs container
        d3.select("#graphs").call( function(div) {

          // An axis at the top
          div.append("div")
              .attr("class", "axis")
              .call(context.axis().orient("top"));

          // All the horizon graphs
          div.selectAll(".horizon")
              .data(metrics)
              .enter().append("div")
              .attr("class", "horizon")
              .call(context.horizon());

          div.append("div")
              .attr("class", "rule")
              .call(context.rule());

        });
});
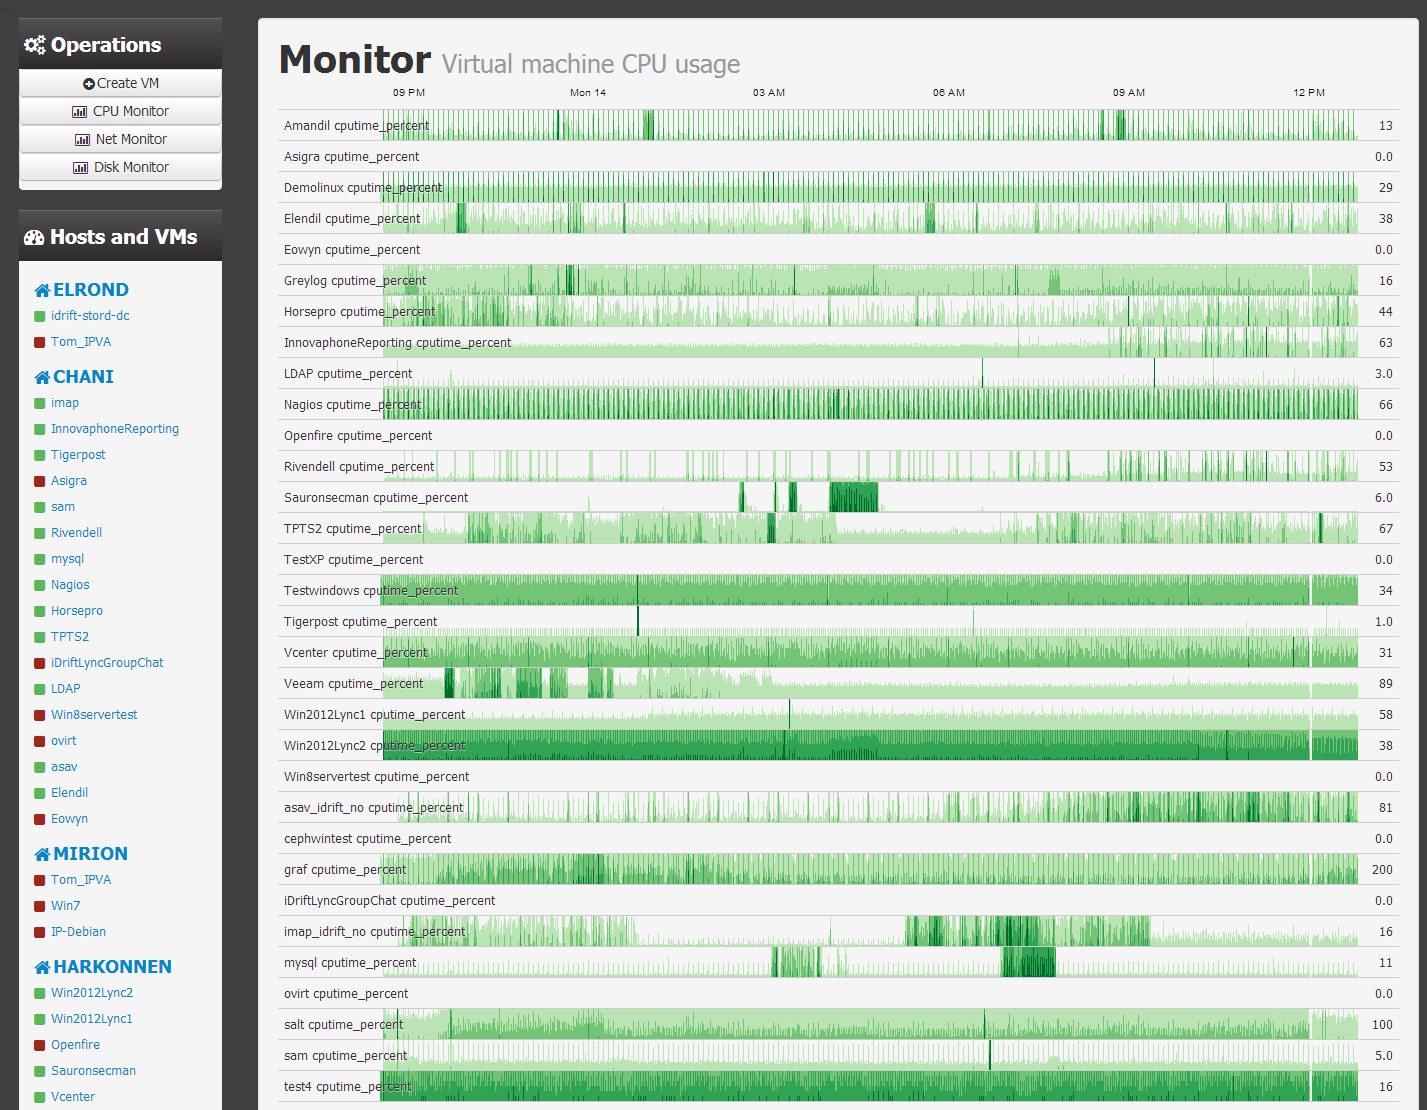
And now I have persistent metrics with a very simple way to visualize them in my VM monitor web front end.
Screenshot of the CPU usage monitor