13 April 2013
Visualizations in CLI using a custom salt outputter
As every sysadmin knows, shit happens. And when it does, you better identify the problem fast. And then you want to monitor the situation until it is resolved. The most common way is perhaps to just gather a ton of metrics, and graph it, and then find the relevant graphs. But sometimes you don't have the right metrics gathered, or you don't have time to find them all, but what you do have is Salt Minion running on all your machines, and it can gather just the data you want, be it numbers of pending mails in mailqueue or number of MySQL connections, etc.
One problem with numbers is that they can be hard to read in a hurried situation, so I figured I'd make a little tool to make CLI graphs out of number gathered using Salt remote execution to gather insights from numbers quickly. A couple of hours of clackity clackity clack later, the block outputter was born!
Screenshots
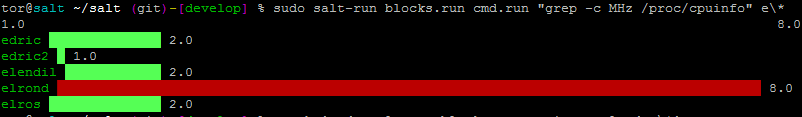
Lets check how many CPUs these minions have:
Lets check the uptime:

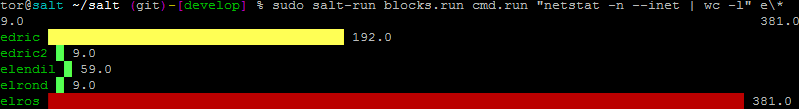
How many connections are opened:
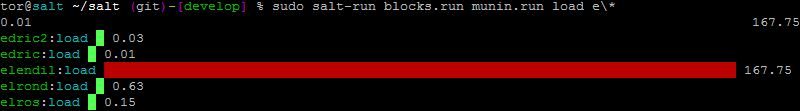
What is the Load ? Oops, looks like we have discovered a problem!
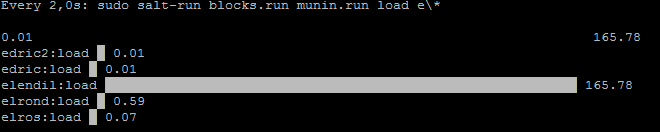
Now that we have discovered the problem, monitor the load until problem is resolved by using the watch command.
Further work
Many metrics are always increasing, not just a current number. Examples of this would be network traffic, nginx requests, CPU usage. The blocks runner could use a --interval parameter and then use the derivative value instead of the absolute to make a very simple network traffic monitor for example.
Right now salt runners does not have a nice way to use the targetting functions from salt regular, so I have not reimplemented anything but the standard globbing. I think salt runners itself should have that capability upstream, so runner writers does not have to reinvent their own targetting.
When the runner can be used in the interval style, it would be easy to instead of blocks use CLI sparklines instead and get a horizontal view. An example would be pinging hosts with network issues and getting sparklines with colors when they time out, etc.
The block outputter right now is fairly dumb. It should have the capability to parse any datastructure, right now it only supports 1 number per host, or a dict like the one that munin.run returns.
Source
salt/runners/blocks.py
'''
Simple runner that gathers data for the block outputter
'''

import distutils.version

# Import salt libs
import salt.client
import salt.output

def run(fun, arg=(), tgt='*'):
    client = salt.client.LocalClient(__opts__['conf_file'])
    if arg:
        output = client.cmd(tgt, fun, expr_form='glob', arg=(arg,), timeout=__opts__['timeout'])
    else:
        output = client.cmd(tgt, fun, expr_form='glob', timeout=__opts__['timeout'])

    salt.output.display_output(output, 'block', __opts__)
    return output
salt/outputters/block.py
# -*-: coding: UTF-8 -*-
'''
Outputter that displays blocks for numbers, must be ran via runner to get proper extents
'''
# Import python libs
from numbers import Number
import curses
import logging

log = logging.getLogger(__name__)

# Import salt libs
import salt.utils

def __virtual__():
    return 'block'

class BlockDisplay(object):
    '''
    '''

    def __init__(self, cols=80, block='█'):
        self.colors = salt.utils.get_colors(__opts__.get('color'))
        self.cols = cols
        self.block = block
        self.data = {}
        self.minv = 9999999
        self.maxv = -1

    def display(self, ret):
        '''
        Interate data, gather extent, push blocks
        '''

        def nval(val):
            return float(val)

        def colorize(s, color):
            return '{0}{1}{2}'.format(self.colors[color], s, self.colors['ENDC'])

        def blocklen(val):
            blocks = int((val/self.maxv * self.cols)+0.5)
            return blocks

        def procval(key, val):
            try:
                mval = nval(val)
                self.minv = min(mval, self.minv)
                self.maxv = max(mval, self.maxv)
                self.data[key] = mval
            except Exception, e:
                log.debug('Cast error: {0}'.format(e))
                return

        for host in sorted(ret):
            hret = ret[host]
            # only use first part of host, to not use as long line
            host = host.split('.')[0]
            if isinstance(hret, dict):
                for key in sorted(hret):
                    if not key: continue
                    val = hret[key]
                    for metric in sorted(val):
                        procval(host+':'+metric, val[metric])
            else:
                # Will it float?
                procval(host, hret)

        if self.data:
            out = str(self.minv) + ' '*(self.cols-len(str(self.minv))-len(str(self.maxv))) + str(self.maxv) + '\n'
            for key in sorted(self.data):
                val = self.data[key]
                # : used as a separator for multiple values for same host
                if ':' in key:
                    host, metric = key.split(':')
                    host = colorize(host, 'GREEN')
                    metric = colorize(metric, 'CYAN')
                    tout = host + ':' + metric + ' '
                else:
                    host = colorize(key, 'GREEN')
                    tout = host + ' '
                blocknr = blocklen(val)-len(key)-len(str(val))-3
                if blocknr < 1:
                    blocknr = 1
                blocks = self.block*blocknr
                blockper = float(blocklen(val)) / self.cols * 100
                if blockper < 50:
                    blocks = colorize(blocks, 'LIGHT_GREEN')
                elif blockper > 75:
                    blocks = colorize(blocks, 'RED')
                elif blockper >= 50:
                    blocks = colorize(blocks, 'YELLOW')

                out += tout + blocks + ' ' + str(val) + '\n'
            return out

def output(ret):
    curses.setupterm()
    cols = curses.tigetnum('cols')
    block = BlockDisplay(cols)
    return block.display(ret)