12 January 2013
Virtual Machine real time visualizations using cubism and salt
For the impatient, there's a screenshot at the very bottom.
Monitoring is not easy. Fetching metrics and creating graphs is easy. But extracing insight from graphs is quite the other task.
I have been investigating different routes. There's a phletora of solutions all solving different subsets of the problem. As always, I'm looking for solutions that are modular with orthogonal components. That helps the different pieces to do one thing, and do one thing well. During my adventure in the monitoring jungle I came across Cubism. Cubism is a time series visualization plugin in javascript on top of the D3 js library. The best thing about Cubism is how it is able to display alot of data in a really compact manner, by using horizon charts. I got really inspired by watching Mike Bostock explain it all in this video (slides) and promptly decided to try and build my own simple virtual machine monitoring inside my little saltvirt project.
The way cubism works is requesting historic data for a time range, and then polling frequently the backend for fresh data to graph. In the setup I'm about to describe, there's no backend that stores the data I want to graph, so when the user opens up the monitoring it will start out blank and then start populating. For this proof of concept that's fine, since it enables me to graph data without introducing any new compononents into my existing environment. If I wanted this into production, I would use graphite, cube or even write a salt returner into mongodb for storing the time series data.
The Salt module function to poll data
I added a utility function to the existing Salt module virt.py to fetch CPU usage. It supports returning all VMs or a single named VM:
salt/modules/virt.py
def vm_cputime(vm_=None):
    '''
    Return cputime used by the vms on this hyper in a
    list of dicts::

        [
            'your-vm': {
                'cputime' <int>
                'cputime_percent' <float>
                },
            ...
            ]

    If you pass a VM name in as an argument then it will return info
    for just the named VM, otherwise it will return all VMs.

    CLI Example::

        salt '*' virt.vm_cputime
    '''
    host_cpus = __get_conn().getInfo()[2]
    def _info(vm_):
        dom = _get_dom(vm_)
        raw = dom.info()
        cputime = int(raw[4])
        cputime_percent = 0
        if cputime:
            cputime_percent = 1.0e-7 * cputime / host_cpus
        return {
                'cputime': int(raw[4]),
                'cputime_percent': '%.0f' %cputime_percent
               }
    info = {}
    if vm_:
        info[vm_] = _info(vm_)
    else:
        for vm_ in list_vms():
            info[vm_] = _info(vm_)
    return info
The HTML
Include the requirements and specify the graph container.
index.html
<script src="/static/d3.v3.min.js"></script>
<script src="/static/cubism.v1.min.js"></script>
<div id="graphs"></div>
The JavaScript
As I noted earlier, this is a proof of concept, and its biggest weak spot is in the javascript below. I feed one metric to cubism per VM. Each metric has a callback that runs 1 salt call to its corresponding VM. So in effect you have 1 AJAX call per VM per second, which translates into 1 salt command per second. This will make salt API, salt and the libvirtd processes very busy and it will even impact the performance on each of these systems. To improve this, one would have to change this to make a javascript cubism backend that has 1 ajax call for ALL the VMs, and then split the results into proper arrays that cubism can read. I didn't spend time fixing this because I think the road ahead is using a proper database backend anyway.
saltvirt.js
// Create cubism context
context = cubism.context()
    .serverDelay(10 * 1000) // allow 10 seconds of collection lag
    .step(1 * 1000)         // 1 seconds per value
    .size(1080);            // fetch 1080 values (pixels)

/* Custom metric that polls Salt */
var cputime = function(host, vm) {
    var value = 0,
        values = [],
        realvalues = [],
        i = 0,
        last;
    return context.metric(function(start, stop, step, callback) {
        start = +start, stop = +stop;
        if (isNaN(last)) last = start;
        $.post(api_url_base + '/', tcontext({
            tgt:host,
            fun:'virt.vm_cputime',
            arg:[vm]
        }), function(data) {
            if(data['return'] != undefined) {
                var ret = data['return'][0][host];
                var cputime_percent = parseInt(ret[vm].cputime_percent);
                var lastval = realvalues.slice(-1)[0];
                // Need a real value to calculate diff
                if (lastval > 0) {
                    var thisval = cputime_percent - lastval;
                    values.push(thisval);
                } else {
                    values.push(0);
                }
                realvalues.push(cputime_percent);
            }else {
                // Libvirt no history :(
                // Fill values with 0
                while (last < stop) {
                    last += step;
                    value = 0;
                    values.push(value);
                    realvalues.push(value);
                }
            }
            values = values.slice((start - stop) / step);
            realvalues = realvalues.slice((start - stop) / step);
            callback(null, values );
        });
    }, String(vm).replace(sv.strip_domain,''));
}
// Fetch all the running VMs on all hosts and create metrics for each
$.post(api_url_base + '/', tcontext({
    tgt:'*',     // All minions
    timeout: 30, // wait a bit to get everything
    fun:'virt.list_active_vms' // only fetch active vms
}), function(data) {
    var metrics = []; // list of metrics

    $.each(data['return'], function(oidx, list) {
        $.each(list, function(host, vmlist) {
            // Non-virt-hosts returns "not available"
            if(jQuery.type(vmlist) == jQuery.type([])) {
                $.each(vmlist, function(vmidx, vm) {
                    // Create a metric and add it to the list of metris
                    metrics.push(cputime(host, vm));
                });
            }
        });
    });

    // Create the graphs and add to #graphs container
    d3.select("#graphs").call( function(div) {

      // An axis at the top
      div.append("div")
          .attr("class", "axis")
          .call(context.axis().orient("top"));

      // All the horizon graphs
      div.selectAll(".horizon")
          .data(metrics)
              .enter().append("div")
              .attr("class", "horizon")
              .call(context.horizon().extent([0, 100]));

          div.append("div")
              .attr("class", "rule")
              .call(context.rule());

        });
    });

    // On mousemove, reposition the chart values to match the rule.
    context.on("focus", function(i) {
        d3.selectAll(".value").style("right", i == null ? null : context.size() - i + "px");
    });
});
Screenshot
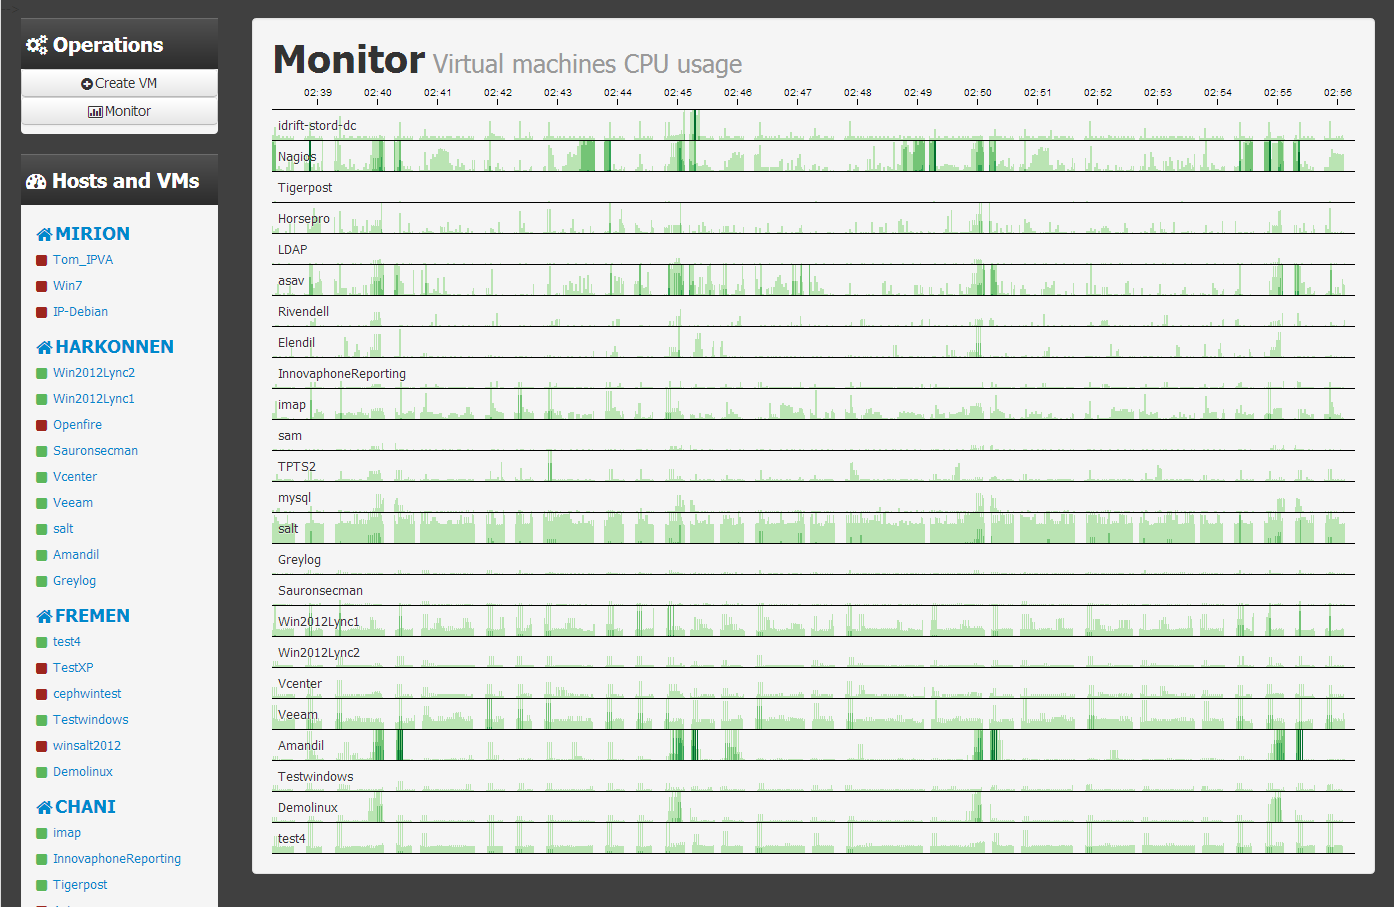
As you can see, most of my VMs in my test cluster are fairly idle. The default in cubism is 4 bands, so when green area is at full height of its 30 pixels, its corresponding CPU usage percentage is 25%. There is some choppiness in the graphs because I dont do any time interpolation and when some of the data does not return in a timely manner it will "queue" and get displayed as a spike. Several ways to fix this, either by not ever getting lost data, or interpolate in js. But again, a proper database backend will deal with this.
CPU Usage
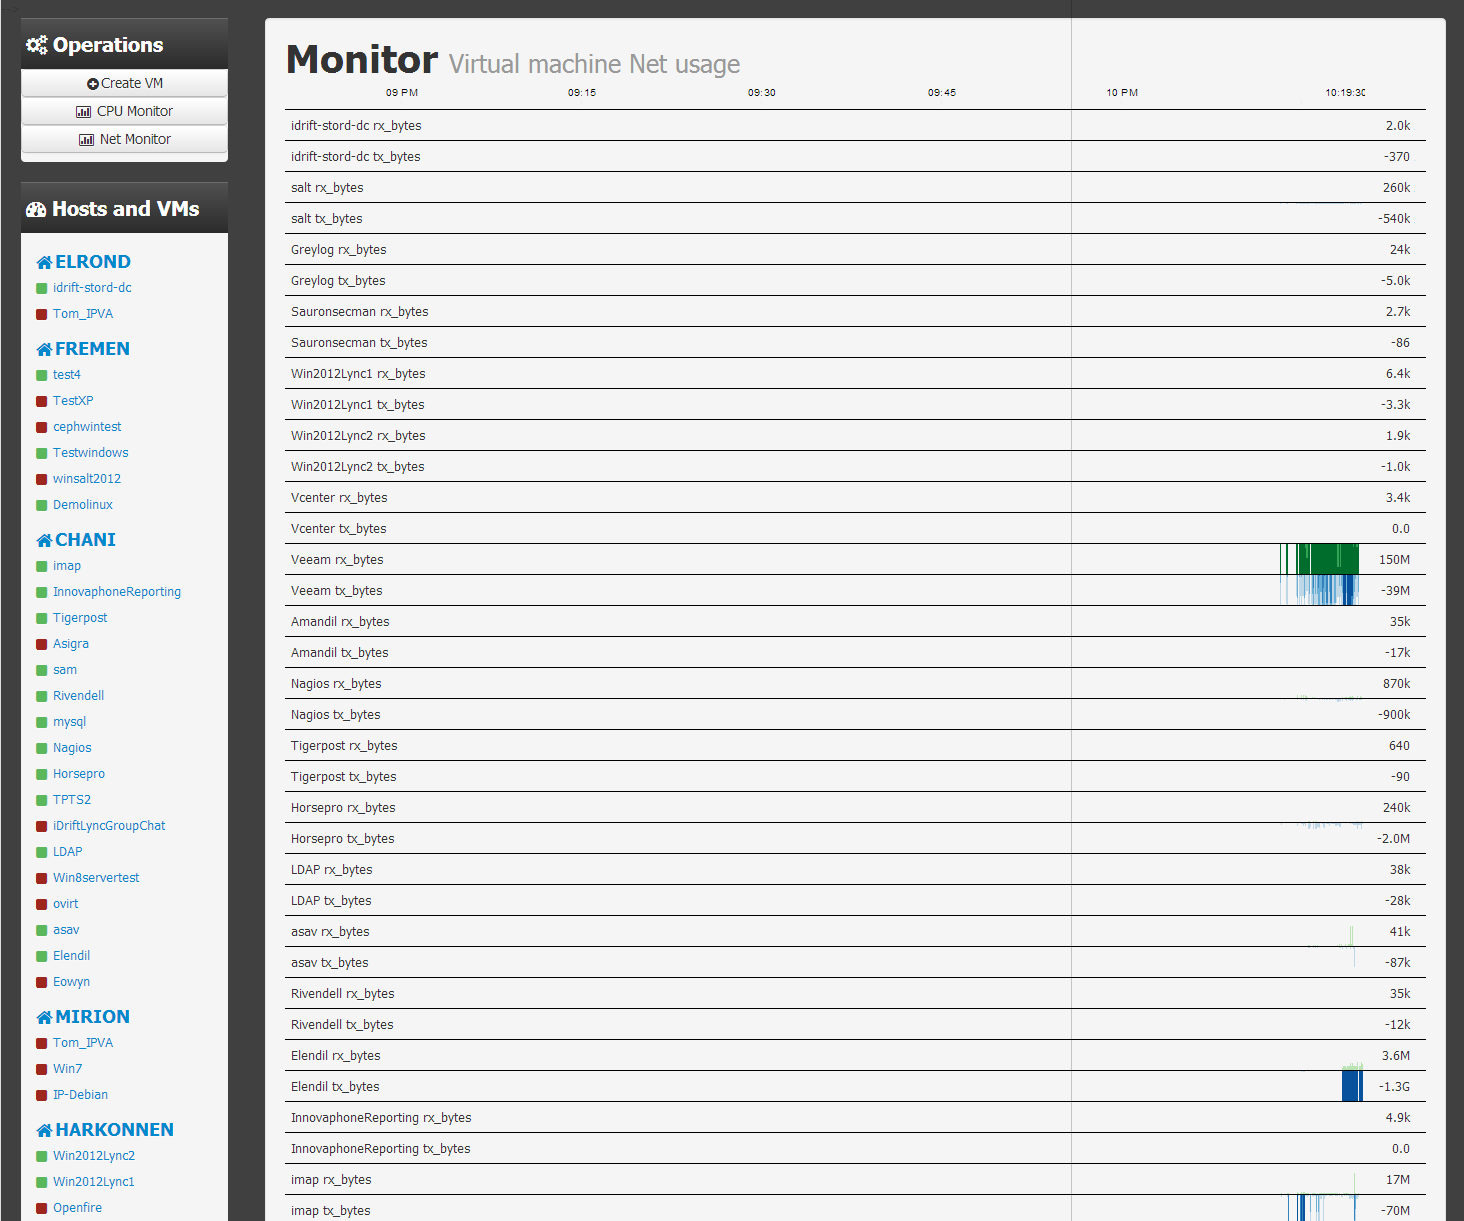
 Net Usage
Update: Check out Part #2 for getting stateful graphing